Adding Gonio graphs to the report
* IQ instrument only
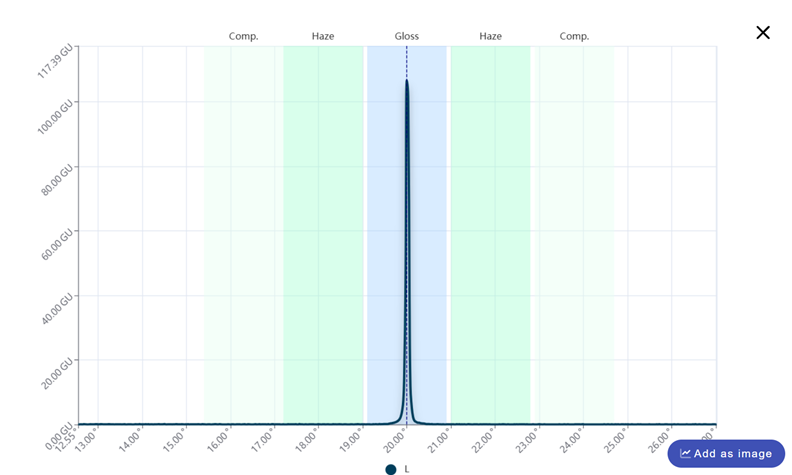
When DATA+ is selected in the connection menu (see page 5) full gonio curve data is transmitted to the app. This can be added to the PDF report as an image. Gonio data is also available in the .CSV export.
In the results table click on the graph icon in the curve column.

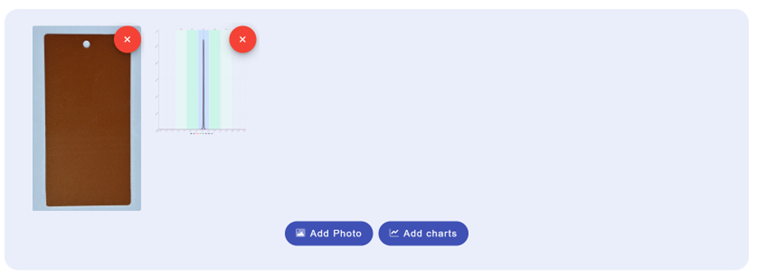
A new screen will open showing the Gonio curve. In the bottom right of the screen selecting Add as image will place the individual curve for that reading in the report.

If multiple readings have been taken on the same measurement spot a single graph showing all traces can be added by pressing the Add charts button.

Last modified: 07 February 2025